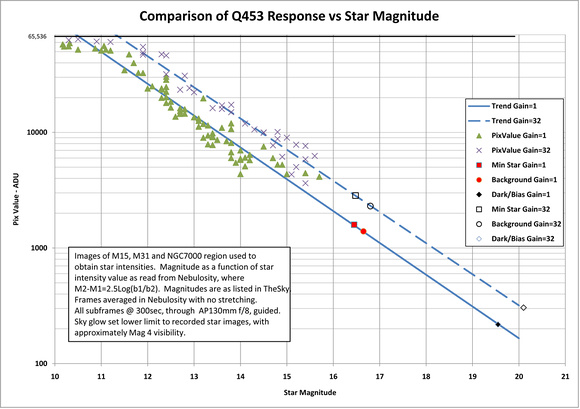
Comparison of Q453 Response vs Star Magnitude
5 minute images were used to create response curves, comparing Q453 gain settings. In each case several (6 to 24) individual subs were aligned and stacked to create a final image. All images were processed to remove bad pixels in Nebulosity and corrected for bias. No dark frame subtraction or flats were utilized. Subs were combined in Nebulosity using straight average, with no stretching. Stars intensity values were read in Nebulosity and referenced to star magnitude values from "TheSky". The Trend lines were created from the center linear portion of each data set. The values for dark, background, and dimmest stars were placed on the trend lines for reference. No actual magnitude values were available for these data points.
Conclusions:
1. Background sky glow sets the lower magnitude limit of imaged stars.
2. The dark levels are about 3 magnitudes below the sky glow at this site.
3. For these values of background sky glow no advantqage is obtained by increasing the gain above 1, in fact the dynamic range is decreased at higher gain levels, since saturation is reached at greater magnitude values.
4. If the projected trend lines are correct, the Q453 can image stars over about an 8 magnitude range from just above the dark floor to saturation.